PSF, MTF and Strehl ratio
pyoptics.imaging describes a scalar imaging system by its pupil function
\(P(\mathbf{k}_\perp) = A\,\exp(i\Phi)\) on the disk \(|\mathbf{k}_\perp| \le k\,\mathrm{NA}\):
Function |
Result |
|---|---|
|
the sampled pupil \(P\) (circular pupil times an optional mask \(A\), times \(\exp(i\Phi)\)) |
|
amplitude point spread function \(h = \mathcal{F}^{-1}[P]\), by default normalized such that \(\lvert h(0)\rvert^2\) is the Strehl ratio |
|
optical transfer function \(\mathrm{OTF} = \mathcal{F}[\lvert h\rvert^2]/\mathcal{F}[\lvert h\rvert^2](0)\) and \(\mathrm{MTF} = \lvert\mathrm{OTF}\rvert\) |
|
exact Strehl ratio, rms phase error and its Maréchal-type approximations |
Masks and phases are arrays on the frequency grid or callables of the
normalized pupil coordinates \((P_x, P_y) = (k_x, k_y)/(k\,\mathrm{NA})\), the
unit disk. Fringe Zernikes with R_norm=1 evaluated at \((P_x, P_y)\) thus
give the usual pupil aberrations. pyoptics.analytical provides the
reference results: the Airy pattern, its encircled energy and the
diffraction limited OTF of a circular pupil.
Convention: \(\exp(i(\mathbf{k}\cdot\mathbf{r} - \omega t))\). A pupil phase \(k_x s\) therefore moves the PSF to \(x = -s\).
import numpy as np
import matplotlib.pyplot as plt

from pyoptics import imaging
from pyoptics.analytical import airy_pattern, airy_encircled_energy, circular_otf
from pyoptics.bases import FringeZernikes
from pyoptics.utils import grid2d, freq_grid

plt.rcParams.update({"figure.dpi": 100, "image.origin": "lower", "font.size": 11})

wl, NA = 0.5, 0.25            # µm
k = 2*np.pi/wl
L, N = 64.0, 512              # dx = 0.125 µm = wl/(16 NA); pupil radius L*NA/wl = 32 samples
x, y, X, Y = grid2d(-L/2, L/2, -L/2, L/2, N)
c = N//2
f = freq_grid(x, y, wavenumbers=False)[0][c]   # spatial frequencies in 1/µm
f_c = 2*NA/wl                                   # incoherent cut-off frequency

Z = FringeZernikes(x, y)  # only used to evaluate Zernikes at pupil coordinates (eval_single_scattered)

def zernike_phase(coeffs):
    """Pupil phase (callable) from {Fringe index: coefficient in waves}."""
    return lambda px, py: 2*np.pi*sum(a*Z.eval_single_scattered(px, py, j) for j, a in coeffs.items())

print(f"Airy radius 0.61 λ/NA = {0.61*wl/NA:.2f} µm, cut-off frequency 2NA/λ = {f_c:.2f} / µm")
Airy radius 0.61 λ/NA = 1.22 µm, cut-off frequency 2NA/λ = 1.00 / µm
1. The Airy pattern
Without aberrations, the intensity PSF of a circular pupil is the Airy pattern \(I(r) = \left(2 J_1(v)/v\right)^2\) with \(v = 2\pi\,\mathrm{NA}\,r/\lambda\). Its encircled energy is Rayleigh’s \(1 - J_0^2(v) - J_1^2(v)\): 83.8 % of the light lies within the first dark ring at \(0.61\,\lambda/\mathrm{NA}\), 91 % within the second.
h = imaging.get_psf(x, y, NA, k)
I = np.abs(h)**2

r = np.hypot(X, Y)
r_bins = np.linspace(0, 6*wl/NA, 300)
EE = np.array([I[r <= rb].sum() for rb in r_bins])/I.sum()

fig, axes = plt.subplots(1, 3, figsize=(15, 4.2))
ext = (x[0], x[-1], y[0], y[-1])
axes[0].imshow(I**0.3, extent=ext, cmap="inferno")
axes[0].set_xlim(-4, 4); axes[0].set_ylim(-4, 4)
axes[0].set_title("$I^{0.3}$ (to show the rings)"); axes[0].set_xlabel("$x$ [µm]")

axes[1].semilogy(x, I[c], lw=2, label="get_psf()")
axes[1].semilogy(x, airy_pattern(np.abs(x), NA, wl), "k--", lw=1, label="$(2J_1(v)/v)^2$")
axes[1].set_xlim(0, 10); axes[1].set_ylim(1E-5, 1.5)
axes[1].set_xlabel("$x$ [µm]"); axes[1].set_title("Profile, peak normalized to 1"); axes[1].legend()

axes[2].plot(r_bins*NA/wl, EE, lw=2, label="numerical")
axes[2].plot(r_bins*NA/wl, airy_encircled_energy(r_bins, NA, wl), "k--", lw=1, label="$1 - J_0^2 - J_1^2$")
for rz in (0.61, 1.12, 1.62):
    axes[2].axvline(rz, color="gray", lw=0.7, ls=":")
axes[2].set_xlabel("$r$ [λ/NA]"); axes[2].set_ylabel("encircled energy"); axes[2].legend()
axes[2].set_title("Encircled energy (dotted: dark rings)")
fig.tight_layout()

print("peak intensity:", I[c, c], "  max deviation from the Airy profile:",
      np.abs(I[c] - airy_pattern(np.abs(x), NA, wl)).max())
peak intensity: 1.0 max deviation from the Airy profile: 0.0008663177221973229
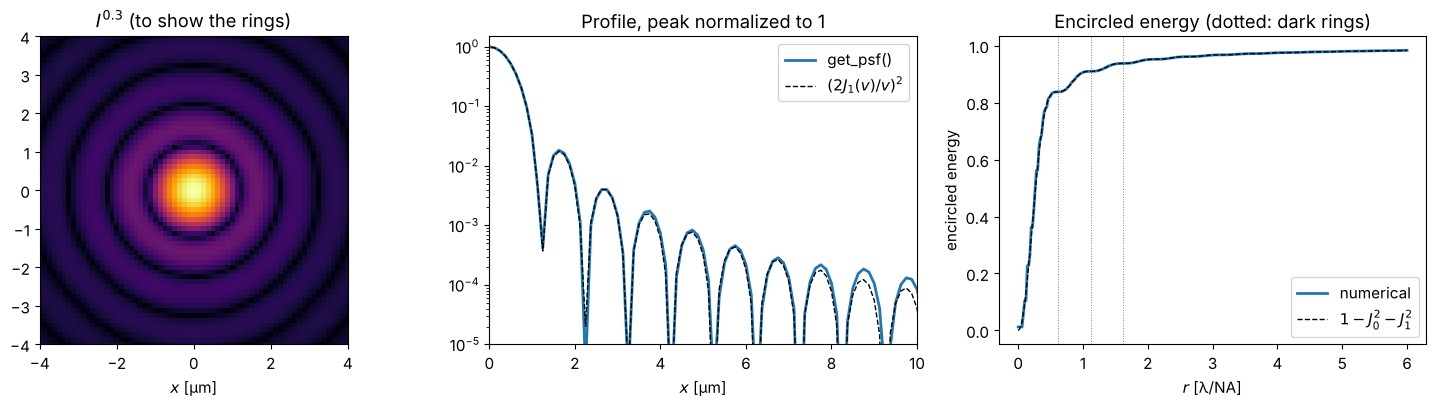
The small deviations come from the pupil: it is sampled on the frequency grid with spacing \(2\pi/L\), i.e. with about \(L\,\mathrm{NA}/\lambda = 32\) samples across its radius, so its edge is slightly staircased. A larger window \(L\) samples the pupil more finely.
2. MTF of a circular and of an obscured pupil
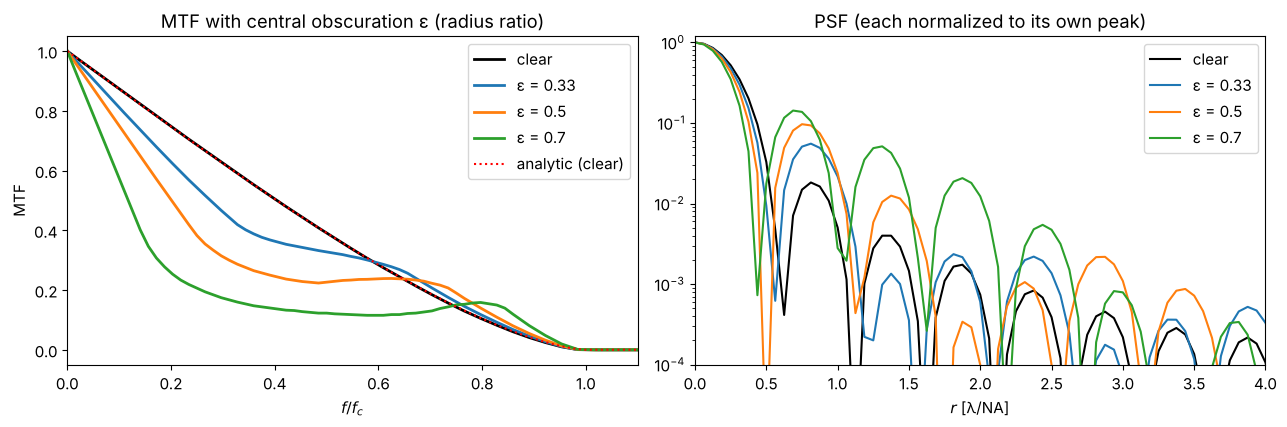
The OTF is the autocorrelation of the pupil. For a clear circular pupil it is \(\frac{2}{\pi}\left(\arccos s - s\sqrt{1-s^2}\right)\) with \(s = f/f_c\) and the cut-off \(f_c = 2\,\mathrm{NA}/\lambda\), twice the coherent cut-off.
Telescopes often have a central obscuration (secondary mirror). The annular pupil keeps the cut-off frequency but transfers less contrast at middle frequencies and slightly more near the cut-off; in the PSF, the central peak narrows and more energy moves into the rings.
fig, axes = plt.subplots(1, 2, figsize=(13, 4.4))
for eps, color in zip((0.0, 0.33, 0.5, 0.7), ("k", "C0", "C1", "C2")):
    mask = (lambda px, py, e=eps: px**2 + py**2 >= e**2) if eps > 0 else None
    mtf = imaging.get_mtf(x, y, NA, k, pupil_mask=mask)
    psf = np.abs(imaging.get_psf(x, y, NA, k, pupil_mask=mask))**2
    label = "clear" if eps == 0 else f"ε = {eps}"
    axes[0].plot(f[c:]/f_c, mtf[c, c:], color=color, lw=2, label=label)
    axes[1].semilogy(x[c:]*NA/wl, psf[c, c:], color=color, lw=1.5, label=label)
axes[0].plot(f[c:]/f_c, circular_otf(f[c:], NA, wl), "r:", lw=1.5, label="analytic (clear)")
axes[0].set_xlim(0, 1.1); axes[0].set_xlabel("$f/f_c$"); axes[0].set_ylabel("MTF"); axes[0].legend()
axes[0].set_title("MTF with central obscuration ε (radius ratio)")
axes[1].set_xlim(0, 4); axes[1].set_ylim(1E-4, 1.2)
axes[1].set_xlabel("$r$ [λ/NA]"); axes[1].set_title("PSF (each normalized to its own peak)"); axes[1].legend()
fig.tight_layout()
3. Defocus: contrast loss and contrast reversal
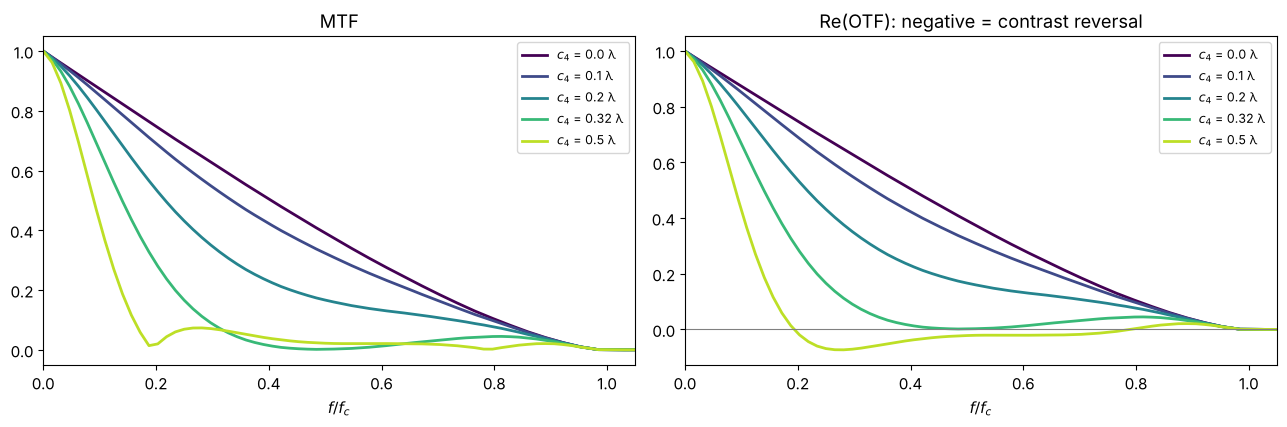
With aberrations the OTF becomes complex and drops. Defocus is the classic case (Hopkins 1955): beyond a defocus coefficient of about 0.32 λ (Fringe \(Z_4\), i.e. a peak-to-valley wavefront error of 0.64 λ) the OTF reaches zero at middle frequencies and then turns negative: bars of that period are imaged with inverted contrast (bright and dark swapped). The MTF only shows the modulus; the real part of the OTF shows the sign change.
fig, axes = plt.subplots(1, 2, figsize=(13, 4.4))
for a, color in zip((0.0, 0.1, 0.2, 0.32, 0.5), plt.cm.viridis(np.linspace(0, 0.9, 5))):
    otf = imaging.get_otf(x, y, NA, k, phase=zernike_phase({4: a}))
    axes[0].plot(f[c:]/f_c, np.abs(otf[c, c:]), color=color, lw=2, label=f"$c_4$ = {a} λ")
    axes[1].plot(f[c:]/f_c, otf[c, c:].real, color=color, lw=2, label=f"$c_4$ = {a} λ")
axes[0].set_title("MTF"); axes[1].set_title("Re(OTF): negative = contrast reversal")
axes[1].axhline(0, color="gray", lw=0.8)
for ax in axes:
    ax.set_xlim(0, 1.05); ax.set_xlabel("$f/f_c$"); ax.legend(fontsize=9)
fig.tight_layout()
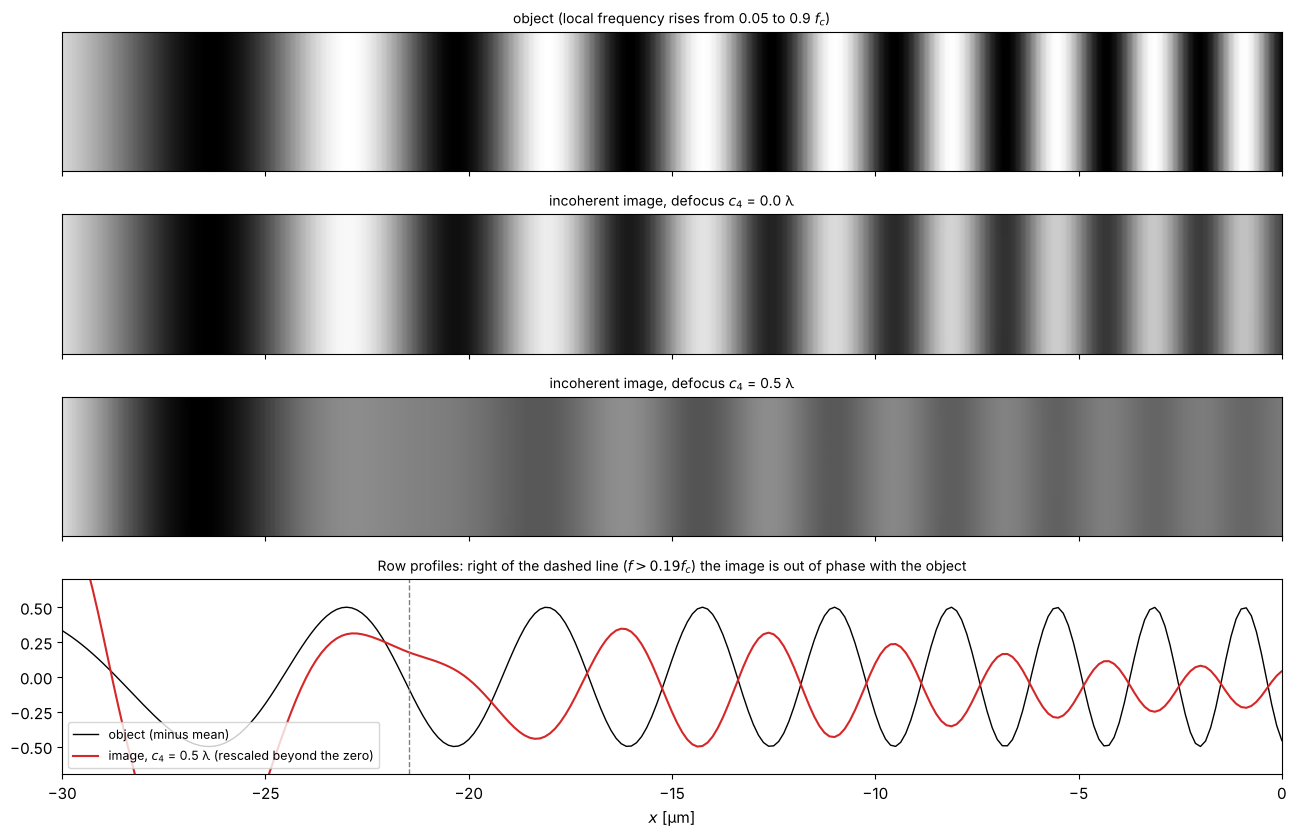
The contrast reversal is directly visible in the incoherent image of a “chirped” bar pattern whose period decreases from left to right. With \(c_4 = 0.5\) λ the contrast vanishes at \(f \approx 0.19 f_c\) and comes back inverted beyond (compare the phase of the stripes with the object):
from pyoptics.fft import FT, inv_FT
f_local = f_c*(0.05 + 0.85*(X - x[0])/L)                       # local frequency rises along x
phase_chirp = 2*np.pi*np.cumsum(f_local, axis=1)*(x[1] - x[0])
obj = 0.5*(1 + np.cos(phase_chirp))*(np.abs(Y) < 20)

fig, axes = plt.subplots(4, 1, figsize=(13, 8.5), sharex=True,
                         gridspec_kw={"height_ratios": [1, 1, 1, 1.4]})
images = {}
for ax, a in zip(axes, (None, 0.0, 0.5)):
    if a is None:
        img, title = obj, "object (local frequency rises from 0.05 to 0.9 $f_c$)"
    else:
        otf = imaging.get_otf(x, y, NA, k, phase=zernike_phase({4: a}))
        img = np.real(inv_FT(FT(obj)*otf))
        images[a] = img
        title = f"incoherent image, defocus $c_4$ = {a} λ"
    ax.imshow(img[c - 24:c + 24], extent=(x[0], x[-1], y[c - 24], y[c + 24]), cmap="gray", aspect="auto")
    ax.set_title(title, fontsize=10)
    ax.set_yticks([])
x_rev = x[0] + L*(0.19 - 0.05)/0.85   # where the local frequency reaches the zero of the OTF
modulation = images[0.5][c] - images[0.5][c].mean()
axes[3].plot(x, obj[c] - 0.5, "k-", lw=1, label="object (minus mean)")
axes[3].plot(x, modulation/np.abs(modulation[(x > x_rev + 2) & (x < 0)]).max()*0.5, "C3-", lw=1.5,
             label="image, $c_4$ = 0.5 λ (rescaled beyond the zero)")
axes[3].axvline(x_rev, color="gray", ls="--", lw=1)
axes[3].set_xlim(-30, 0); axes[3].set_ylim(-0.7, 0.7); axes[3].legend(fontsize=9, loc="lower left")
axes[3].set_title("Row profiles: right of the dashed line ($f > 0.19 f_c$) the image is out of phase with the object", fontsize=10)
axes[-1].set_xlabel("$x$ [µm]")
fig.tight_layout()
4. Strehl ratio and the Maréchal approximation
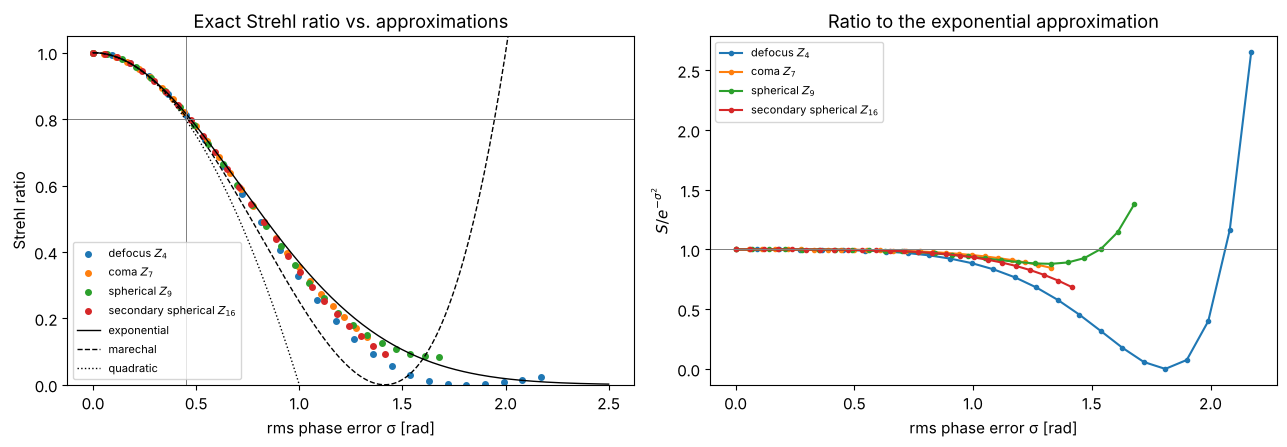
The Strehl ratio is the intensity at the Gaussian image point relative to the aberration-free system, \(S = \lvert\langle e^{i\Phi}\rangle\rvert^2\), the average running over the pupil. For small rms phase errors \(\sigma\) (piston removed)
The Maréchal criterion \(S \ge 0.8\) corresponds to \(\sigma \le 0.47\) rad, i.e. an rms wavefront error of λ/14. The exponential form (Mahajan) holds to much larger errors for most aberrations, but none of the approximations is universal: the true \(S\) depends on the shape of the aberration, not only on \(\sigma\).
names = {4: "defocus $Z_4$", 7: "coma $Z_7$", 9: "spherical $Z_9$", 16: "secondary spherical $Z_{16}$"}
fig, axes = plt.subplots(1, 2, figsize=(13, 4.6))
sigma_ref = np.linspace(0, 2.5, 200)
for j, name in names.items():
    amps = np.linspace(0, 0.6, 25)
    sig = [imaging.rms_phase(x, y, NA, k, phase=zernike_phase({j: a})) for a in amps]
    S = [imaging.strehl_ratio(x, y, NA, k, phase=zernike_phase({j: a})) for a in amps]
    axes[0].plot(sig, S, "o", ms=4, label=name)
    axes[1].plot(sig, np.array(S)/imaging.marechal_strehl(np.array(sig)), "o-", ms=3, label=name)
for approx, ls in (("exponential", "k-"), ("marechal", "k--"), ("quadratic", "k:")):
    axes[0].plot(sigma_ref, imaging.marechal_strehl(sigma_ref, approx), ls, lw=1, label=approx)
axes[0].axhline(0.8, color="gray", lw=0.7); axes[0].axvline(2*np.pi/14, color="gray", lw=0.7)
axes[0].set_ylim(0, 1.05); axes[0].set_xlabel("rms phase error σ [rad]"); axes[0].set_ylabel("Strehl ratio")
axes[0].set_title("Exact Strehl ratio vs. approximations"); axes[0].legend(fontsize=8)
axes[1].axhline(1, color="gray", lw=0.7)
axes[1].set_xlabel("rms phase error σ [rad]"); axes[1].set_ylabel("$S / e^{-σ^2}$")
axes[1].set_title("Ratio to the exponential approximation"); axes[1].legend(fontsize=8)
fig.tight_layout()
Because get_psf() normalizes to the aberration-free peak, the central value
of an aberrated intensity PSF is the Strehl ratio:
phase = zernike_phase({9: 0.1, 7: 0.05})
h_ab = imaging.get_psf(x, y, NA, k, phase=phase)
sigma = imaging.rms_phase(x, y, NA, k, phase=phase)
print(f"|h(0)|^2            = {np.abs(h_ab[c, c])**2:.4f}")
print(f"strehl_ratio()      = {imaging.strehl_ratio(x, y, NA, k, phase=phase):.4f}")
print(f"exp(-sigma^2)       = {imaging.marechal_strehl(sigma):.4f}   (sigma = {sigma:.3f} rad = λ/{2*np.pi/sigma:.1f})")
|h(0)|^2            = 0.9132
strehl_ratio()      = 0.9132
exp(-sigma^2)       = 0.9134   (sigma = 0.301 rad = λ/20.9)
5. Apodization
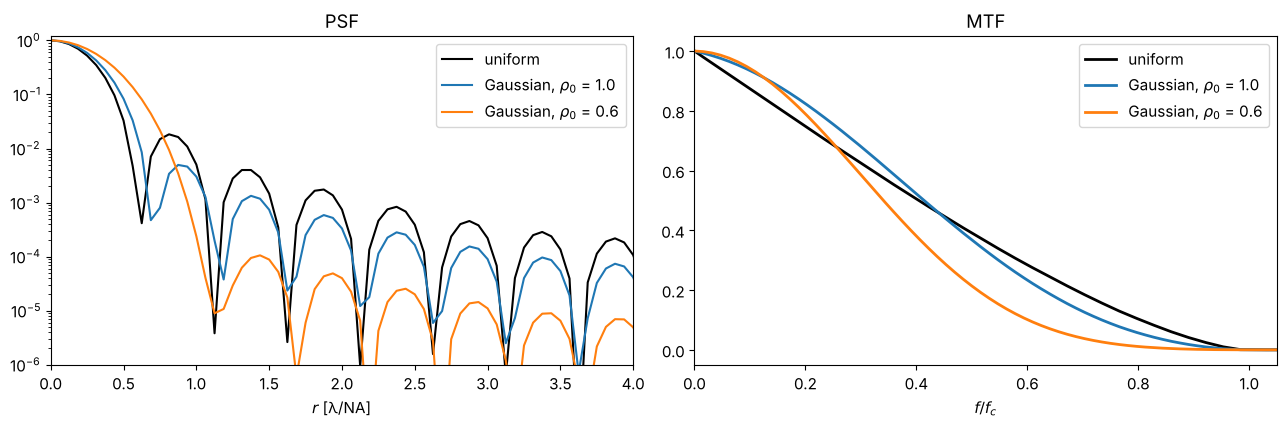
A pupil whose transmission falls off towards the edge (here a Gaussian
amplitude \(A = \exp(-\rho^2/\rho_0^2)\)) trades resolution for suppressed side
lobes: the central peak widens, the rings almost vanish. pupil_mask accepts
such real-valued masks. With the “peak” normalization, the aberration-free
apodized PSF again has the peak 1, so Strehl ratios refer to the apodized
system.
fig, axes = plt.subplots(1, 2, figsize=(13, 4.4))
for rho0, color in zip((None, 1.0, 0.6), ("k", "C0", "C1")):
    mask = None if rho0 is None else (lambda px, py, r0=rho0: np.exp(-(px**2 + py**2)/r0**2))
    I_ap = np.abs(imaging.get_psf(x, y, NA, k, pupil_mask=mask))**2
    mtf = imaging.get_mtf(x, y, NA, k, pupil_mask=mask)
    label = "uniform" if rho0 is None else f"Gaussian, $ρ_0$ = {rho0}"
    axes[0].semilogy(x[c:]*NA/wl, I_ap[c, c:], color=color, lw=1.5, label=label)
    axes[1].plot(f[c:]/f_c, mtf[c, c:], color=color, lw=2, label=label)
axes[0].set_xlim(0, 4); axes[0].set_ylim(1E-6, 1.2); axes[0].set_xlabel("$r$ [λ/NA]")
axes[0].set_title("PSF"); axes[0].legend()
axes[1].set_xlim(0, 1.05); axes[1].set_xlabel("$f/f_c$"); axes[1].set_title("MTF"); axes[1].legend()
fig.tight_layout()
References
J. W. Goodman, Introduction to Fourier Optics, 4th ed., W. H. Freeman (2017).
M. Born and E. Wolf, Principles of Optics, 7th ed., Cambridge University Press (1999).
V. N. Mahajan, Optical Imaging and Aberrations, Part II: Wave Diffraction Optics, 2nd ed., SPIE Press (2011).
G. D. Boreman, Modulation Transfer Function in Optical and Electro-Optical Systems, SPIE Press (2001).
H. H. Hopkins, “The frequency response of a defocused optical system”, Proc. R. Soc. Lond. A 231, 91-103 (1955).